Optical Time
Domain Reflectometer (OTDR)
Download free OTDR
Trainer Software for PCs
After you study this page, you can download a free OTDR Trainer to run on your PC.
The Optical Time Domain Reflectometer (OTDR) is useful for
testing the integrity of fiber optic cables. It can verify
splice loss, measure length and find faults. The OTDR is
also commonly used to create a "picture" of fiber optic
cable when it is newly installed. Later, comparisons can be
made between the original trace and a second trace taken if
problems arise. Analyzing the OTDR trace is always made
easier by having documentation from the original trace that
was created when the cable was installed.
OTDRs are most effective when testing long cables (more than
aproximately 250 meters or 800 feet) or cable plants with
splices. The data that the OTDR produces are typically used
to create a picture called a "trace" or "signature" that has
valuable information for the trained user and can be stored
for later reference or to check against a blueprint when
network trouble arises. OTDRs should not be used for
measuring insertion loss in the fiber optic cable - that
task is better left to a fiber optic test source and power
meter. OTDRs simply show you where the cables are terminated
and confirm the quality of the fibers, connections and
splices. Of course, OTDR traces are also used for
troubleshooting, since they can show where breaks are in
fiber when traces are compared to installation
documentation.
How Does an OTDR
Work?
Unlike sources and
power meters which measure the loss of the fiber optic cable
plant directly, the OTDR works indirectly. The source and
meter duplicate the transmitter and receiver of the fiber
optic transmission link, so the measurement correlates well
with actual system loss. The OTDR, however, uses a unique
optical phenomena of fiber to indirectly measure loss.
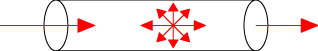
The biggest factor in optical fiber loss is
scattering. In fiber, light is scattered in all
directions, including some scattered back toward the source
as shown here. The OTDR uses this "backscattered light" to
make measurements along with reflected light from connectors
or cleaved fiber ends.
The OTDR consists of
a high power laser transmitter that sends a pulse of light
down the fiber. Back-scattered light and reflected light
returns to the OTDR through the fiber and is directed to a
sensitive receiver thorugh a coupler in the OTDR front end.
For each measurement, the OTDR sends out a very high power
pulse and measures the light coming back over time. At any
point in time, the light the OTDR sees is the light
scattered from the pulse passing through a region of the
fiber. Think of the OTDR pulse as being a "virtual source"
created by the scattering that is testing all the fiber
between itself and the OTDR as it moves down the fiber.
Since it is possible to calibrate the speed of the pulse as
it passes down the fiber from the index of refraction of the
glass in the core of the fiber, the OTDR can correlate what
it sees in backscattered light with an actual location in
the fiber. Thus it can create a display of the amount of
backscattered light at any point in the fiber along its
length.
There are some calculations involved. Remember the light has
to go out and come back, so you have to factor that into the
time calculations, cutting the time in half. One must also
cut the loss in half, since the light sees loss both ways.
The power loss is a logarithmic function, so the power is
measured and displayed in dB.
The amount of light scattered back to the OTDR is
proportional to the backscatter of the fiber, peak power of
the OTDR test pulse and the length of the pulse sent out. If
you need more backscattered light to get good measurements,
you can increase the pulse peak power or pulse width or send
out more pulses and average the returned signals. All three
are used in many OTDRs, with user control of some of the
selections.
This is a typical OTDR trace. The high powered test pulse from the OTDR
overloads the receiver of the OTDR and creates a "dead zone" near the
instrument. The distance scale tells how long the fiber is being tested
and the location of "events" like splices, connectors, stress or breaks
in the fiber. The slope of the fiber shows the attenuation of the fiber.
drops in power after an event can be measured as loss.
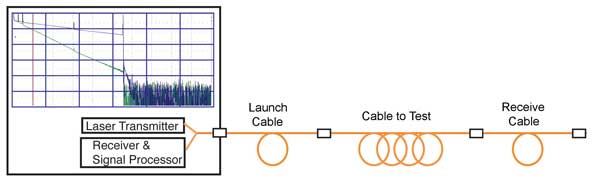
OTDRs are always used with a launch cable and often use a
receive cable. The launch cable, sometimes also called a
"pulse suppressor," allows the OTDR to settle down after the
test pulse is sent into the fiber creating the dead zone and provides a reference
connector for the first connector on the cable under test to
determine its loss. A receive cable may be used on the far
end to allow measurements of the connector on the end of the
cable under test also.
Information
in the OTDR Trace
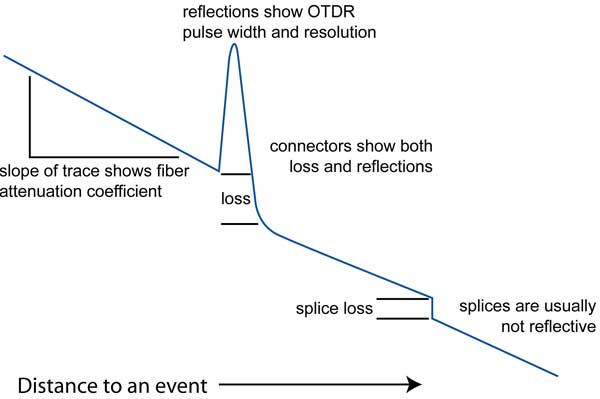
They say a picture
is worth a thousand words, and the OTDR picture (or "trace"
as they are called) takes a lot of words to describe all the
information in it! Consider the diagram of a trace at the
right.
The slope of the fiber trace shows the attenuation
coefficient of the fiber and is calibrated in dB/km by the
OTDR. In order to measure fiber attenuation, you need a
fairly long length of fiber with no distortions on either
end from the OTDR resolution or overloading due to large
reflections. If the fiber looks nonlinear at either end,
especially near a reflective event like a connector, avoid
that section when measuring loss.
Connectors and splices are called "events" in OTDR jargon.
Both should show a loss, but connectors and mechanical
splices will also show a reflective peak. The height of that
peak will indicate the amount of reflection at the event,
unless it is so large that it saturates the OTDR receiver.
Then peak will have a flat top and tail on the far end,
indicating the receiver was overloaded.
Sometimes, the loss of a good fusion splice will be too
small to be seen by the OTDR. That's good for the system but
can be confusing to the operator. It is very important to
know the lengths of all fibers in the network, so you know
where to look for events and won't get confused when unusual
events show up (like ghosts, we'll describe below.)
Reflective pulses can show you the resolution of the OTDR.
You cannot see two events closer than is allowed by the
pulse width. Generally longer pulse widths are used to be
able to see farther along the cable plant and narrower
pulses are used when high resolution is needed, although it
limits the distance the OTDR can see.
Here is an
interactive lesson in how to read an OTDR trace from
FOA's Fiber U.
Making
Measurements With The OTDR
Fiber
Attenuation by Two Point Method.
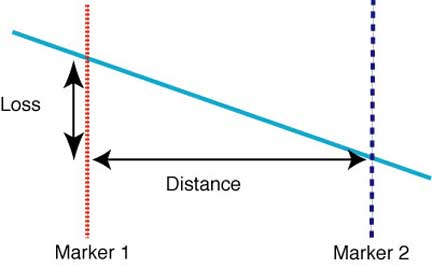
The
OTDR measures distance and loss between the two markers.
This can be used for measuring loss of a length of fiber,
where the OTDR will calculate the attenuation coefficient of
the fiber, or the loss of a connector or splice.
To measure the length and attenuation of the fiber, we place
the markers on either end of the section of fiber we wish to
measure. The OTDR will calculate the distance difference
between the two markers and give the distance. It will also
read the difference between the power levels of the two
points where the markers cross the trace and calculate the
loss, or difference in the two power levels in dB. Finally,
it will calculate the attenuation coefficient of the fiber
by dividing loss by distance and present the result in
dB/km, the normal units for attenuation.
In order to get a good measurement, it is necessary to find
a relatively long section of fiber to give a good baseline
for the measurement. Short distances will mean small amounts
of loss, and the uncertainty of the measurement will be
higher than if the distance is longer. It is also advisable
to stay away from events like splices or connectors, as the
OTDR may have some settling time after these events,
especially if they are reflective, causing the trace to have
nonlinearities caused by the instrument itself.
Fiber
Attenuation by Least Squares Method
The OTDR measures
distance and loss between the two markers but calculates the
best fit line between the two points mathematically using
the "least squares" method to reduce noise. When the markers
are selecting the noisy part of the fiber trace, the least
squares attenuation (2-pt LSA) tool can be applied to
calculate the dB loss between the cursors. Look closely and
you will see a thick grey line between the markers,
indicating the best fit to the trace, averaging all the
noise.
Splice Loss by
Two Point Method
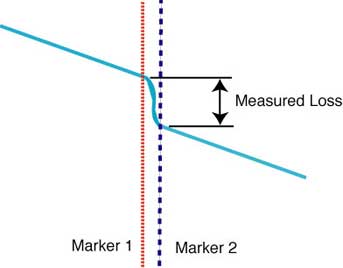
The OTDR measures
distance to the event and loss at an event - a connector or
splice - between the two markers.
To measure splice loss, move the two markers close to the
splice to be measured, having each about the same distance
from the center of the splice. The splice won’t look as neat
as this, with the instrument resolution and noise making the
trace less sharp looking, as you will see later on. The OTDR
will calculate the dB loss between the two markers, giving
you a loss reading in dB.
Measurements of connector loss or splices with some
reflectance will look very similar, except you will see a
peak at the connector, caused by the back reflection of the
connector.
Splice Loss by
Least Squares (LSA)
The OTDR measures
distance and loss at an event - a connector or splice -
between the two markers but calculates the best fit line
between the two points using the "least squares" method to
reduce noise.
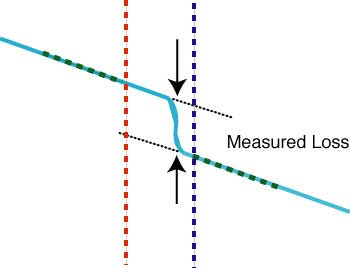
If you noticed, the
markers are separated by some distance, which includes the
loss of some fiber on either side of the actual connector or
splice Most OTDRs will calculate the loss for you by
extrapolating the fiber traces on both sides of the event
and calculating the loss without any influence from the
fiber length. The mathematical method uses is called
"Least Squares Approximation", hence the term "LSA" used by
many OTDRs in their display and setup menus.
Setting LSA requires setting seveeral markers - one on the
peak, the two regular markers near the event and the two end
markers which define the segments used for least-squares
analysis. These segments should be long enough to allow good
measurement but not so long as to approach other events.
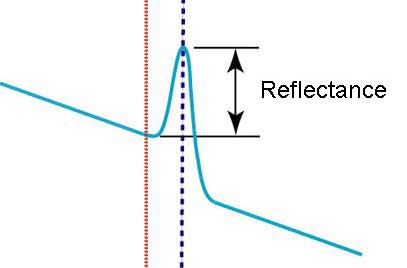
Reflectance
The OTDR
measures the amount of light that's returned from both
backscatter in the fiber and reflected from a connector or
splice. The amount of light reflected is determined by the
differences in the index of refraction of the two fibers
joined, a function of the composition of the glass in the
fiber, or any air in the gap between the fibers, common with
terminations and mechanical splices.
This
is a complicated process involving the baseline of the OTDR,
backscatter level and power in the reflected peak. Like all
backscatter measurements, it has a fairly high measurement
uncertainty, but has the advantage of showing where
reflective events are located so they can be corrected if
necessary.
More
on reflectance/optical return loss testing and alternative
methods .
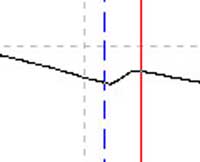
By choosing the
reflectance measurement and putting the right (blue) cursor
on the peak of the reflection and the left (red) cursor just
to the left of the reflection, the OTDR will measure
the reflectance.
Testing A Cable Plant
One of the most common uses for an OTDR is testing an installed fiber
optic cable plant. To do this properly, one needs to use both a launch
cable and a receive cable to include tests for the connectors on each
end of the cable plant.
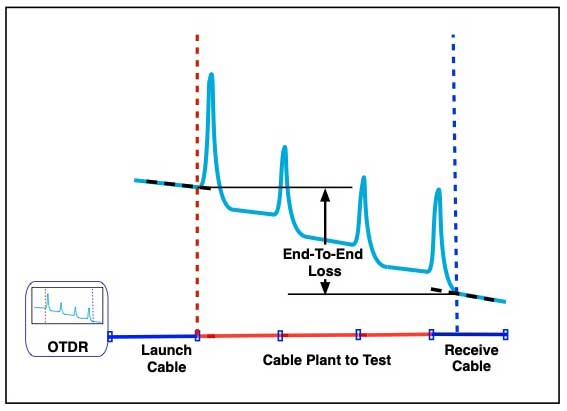
The markers for the test need to be placed before the first connection
(launch cable to cable plant under test) and after the last connection
(cable plant to receive cable) to include both first and last
connections. Some OTDRs are programmed to do this test with least
squares analysis or one can do it using the LSA test on the OTDR and
place the LSA segments on the launch and receive cable.
Comparing Traces
- Comparing two
traces in the same window is useful for confirming data
collection and contrasting different test methods on the
same fiber. Comparisons are also used to compare fiber
traces during troubleshooting with traces take just
after installation to see what has changed. All OTDRs
offer this feature, where you can copy one trace and
paste it on another to compare them. Here is an example
of how you can use this feature.
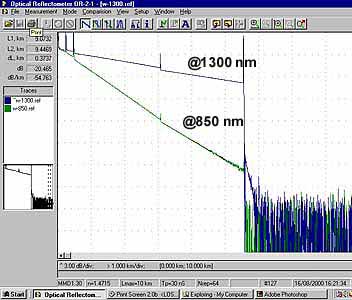
- Note that the
two traces are taken from the same multimode fiber
cable plant at different test wavelengths. The major
difference in the slope of the traces displays the
different attenuation coefficient of the fiber. The blue
line (top) represents the attenuation coefficient of the
cable in at 1300 nm , the green line (bottom) represents
the same cable measured at 850 nm. There is also a
noticable difference in the reflectance at the splice.
Variations in reflectance due to the wavelength
difference is not unusual.
- Other reasons
you might want to compare two traces includes:
- Compare
several fibers in the same cable to see if they are
different.
- Traces taken
at different times to see if the cable has changed.
- At different
wavelengths, since fiber is more sensitive to stress at
longer wavelengths, this allows finding stress points
caused bu installation.
- At different
pulse widths (below) to decide which setting gives the
best compromise between noise and resoluton or to find
events lost with wide pulse widths.
Modifying OTDR
Setup Parameters For Best Test Results
Averaging
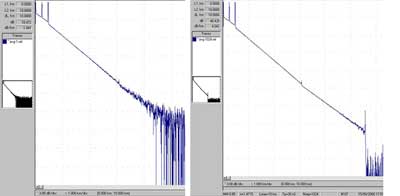
OTDRs can take
multiple samples of the trace and average the results. The
two traces pictured here were captured from the same cable
plant with all of the same settings except for the number
of averages. The trace on the left is only one test, while
the one on the right is averaged from 1024 pulses.
Notice the
difference in the distance that the signal travels before
it the noise level becomes significant. In the image on
the left nRep = 1 or only one sample trace was taken and
the noise becomes significant at only 3 km. On the right,
the noise is very low all the way to the end of the cable
at 5.5 km.
If you are trying
to get longer distances with high resolution, using more
averages with a short test pulse will usually be the best
choice. It will simply take longer to acquire each trace.
Pulse Width
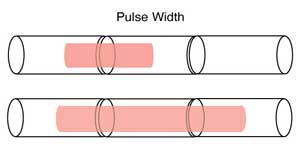
Adjusting the pulse
width is another way to get more measurement distance since
the additional power in the pulse will create a bigger
backscatter signal, but at the loss of resolution between
events. While the longer pulses yield traces with less
noise and longer distance capability, the ability to resolve
and identify events becomes less, and the test pulse
overloads the OTDR reducing its ability to see events
nearby.
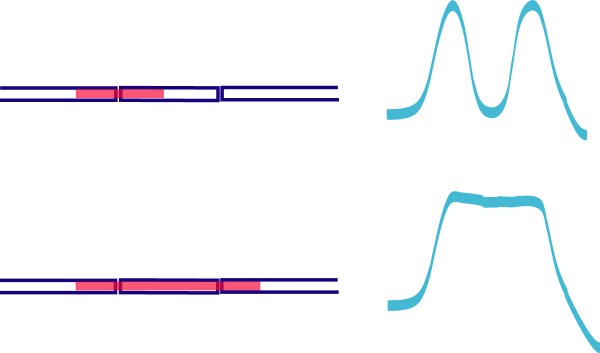
Set the pulse width at the shortest width that allows the
OTDR to reach the end of the cable plant with a reasonable
number of averages. Obviously there are tradeoffs. If you
need short test times you may compromise on a longer pulse
width to reduce the noise. If you need more resolution,
average more with shorter test pulses. Generally, premises
cabling uses the shortest possible pulse and long haul uses
a medium pulse for the first test. Then an analysis of the
trace will tell the operator how to select the right
compromise.
Wavelength
Since fiber has
lower loss at longer wavelength, one can also use the longer
wavelength source to make measurements at longer ranges with
a better signal to noise ratio. You will see this effect in
the next section on comparing traces.
Index of
Refraction
The index of
refraction is the calibration for the speed of light in the
fiber which the OTDR uses to calculate distance in the
fiber. Since fiber optic cable has about 1% excess fiber,
the actual cable length is less than the fiber by that
amount. The OTDR makes its measurements on the fiber, not
the cable, so one must estimate the cable length. If you
have a long length of cable with distances marked on it, you
can measure it with the OTDR and use the index of refraction
to calibrate to the actual cable length. If you do this, we
suggest you make measurements on several fibers and average.
OTDR Measurement
Uncertainty
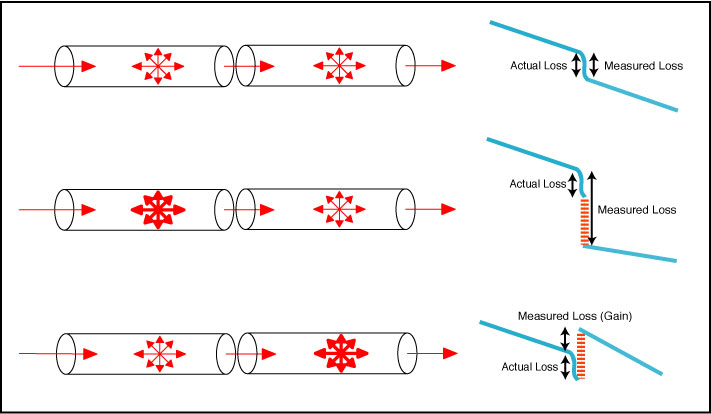
The biggest
source of measurement uncertainty that occurs when testing
with an OTDR is a function of the backscatter coefficient,
the amount of light from the outgoing test pulse that is
scattered back toward the OTDR. The OTDR looks at the
returning signal and calculates loss based on the declining
amount of light it sees coming back. The light scattered
back for measurement is not a constant. It’s a function of
the attenuation of the fiber and the diameter of the core of
the fiber. Higher attenuation fiber has more attenuation
because the glass in it's core scatters more light. If you
look at two different fibers joined together in an OTDR, the
difference in backscattering from each fiber is a major
source of error.
If both fibers are identical, such as splicing a broken
fiber back together, the backscattering will be the same on
both sides of the joint, so the OTDR will measure the actual
splice loss.However, if the fibers are different, the
backscatter coefficients will cause a different percentage
of light to be sent back to the OTDR. If the first fiber has
more attenuation than the one after the connection, the
percentage of light from the OTDR test pulse will go down,
so the measured loss on the OTDR will include the actual
loss plus a loss error caused by the lower backscatter
level, making the displayed loss greater than it actually
is. Looking the opposite way, from a low attenuation fiber
to a high attenuation fiber, we find the backscatter goes
up, making the measured loss less than it actually is. In
fact, if the change in backscatter is greater than the
splice loss, this shows a “gainer”, a major confusion to new
OTDR users.
A real "gainer" - a
splice 35 km away in an installed fiber link.
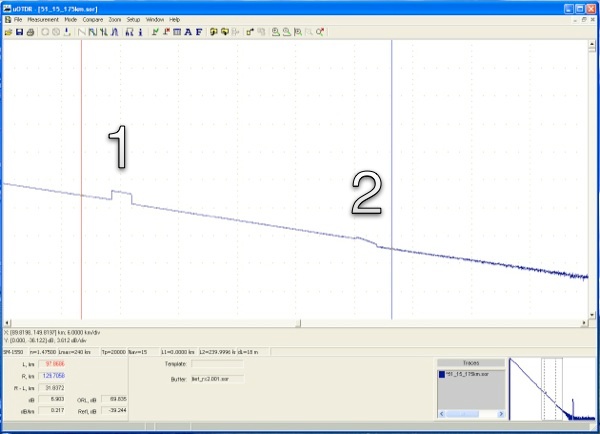
Here is another trace that shows the idea of gainers as they
often show up in real installations. Gainer #1 is a section
of high backscatter fiber, probably with a mode field
diameter difference, spliced into a link. The first splice
on this segment shows a gain, but the second shows a big
loss.
Event 1 shows another important issue about gainers - there
are "losers" too. A gainer in the opposite direction becomes
a loser - the same difference in backscatter coefficient
that causes the gainer in one direction causes a loser in
the other, which can cause considerable problems in splicing
if you only test in one direction. In the loser direction,
the loss shown by the OTDR will always be the actual loss
plus the difference in backscatter coefficient, so even if
the loss from the actual splice is very low, the measured
loss will be high. This can cause problems if you try
resplicing to correct the problem, because the measurement
will always be wrong and show the loss as high.
You can see another good way to determine OTDR splice loss
is untrustworthy with even #2. Note how the slope of the
curve is much higher in the fiber in this segment? Compare
this to the drawing above and you will see another way to
understand when splice loss is untrustworthy. Just measure
the loss of the fiber on either side of the trace and see
whether the direction is high loss > low loss or vice
versa.
While this error source is always present, it can be
practically eliminated by taking readings both ways and
averaging the measurements, and many OTDRs have this
programmed in their measurement routines. This is the only
way to test inline splices for loss and get accurate
results.
OTDR or OLTS?
Many international
standards do not allow OTDRs to be used to measure the loss
of an installed cable plant. Instead insertion loss testing
using an OLTS or source and power meter are required. Read
more about this: 5
Ways To Test Fiber and Accuracy.
OTDR "Ghosts"
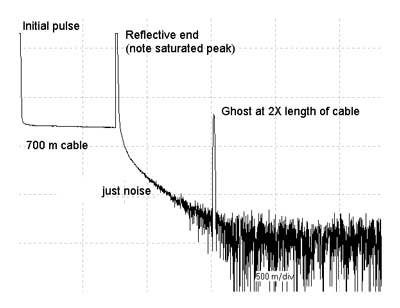
If you are testing
short cables with highly reflective connectors, you will
likely encounter “ghosts.” These are caused by the
reflected light from the far end connector reflecting back
and forth in the fiber until it is attenuated to the noise
level.
Ghosts are very confusing, as they seem to be real
reflective events like connectors, but will not show any
loss. If you find a reflective event in the trace at a point
where there is not supposed to be any connection, but the
connection from the launch cable to the cable under test is
highly reflective, look for ghosts at multiples of the
length of the launch cable or the first cable you
test.
On very short cables, multiple reflections can really
confuse you! We once saw a cable that was tested with an
OTDR and deemed bad because it was broken in the middle. In
fact it was very short and the ghosted image made it look
like a cable with a break in the middle, similar to the
trace shown here. The tester had not looked at the distance
scale or he would have noted the “break” was at 40 meters
and the cable was only 40 meters long. The ghost at 80
meters looked like the end of the cable to him!
You can eliminate ghosts by reducing the reflections, for
example using index matching fluid on the end of the launch
cable.
More on OTDRs
|